Market Watch 2024
Several times throughout the year the Real Estate Industry gathers to hear leading economists and Principal owners, Michael McDonald, and Vic Cooper of Market Watch LLC give their analysis of the current market. They review where we’ve been and take a stab at predicting what’s ahead.
In our meetings, Michael breaks down our market stats and draws comparisons with our feeder markets, Orange, Los Angeles, San Diego Counties. Michael gives a historic perspective into our local markets in addition to looking at developing trends both in our micro markets and valley wide. Walter Niel, President and CEO of Franklin Loan Center joined the discussion with a look at the local and national economy and the forces driving it.
This year at Market Watch
HOME PRICES
Valley Home Prices were essentially unchanged in 2023, but maintained their 50%-70% COVID gains. The exceptions were in the attached condo market, down 1.7% and Active Adult Communities were down 2.8%. All other segments of the market were up. We can expect home prices to remain relatively stable for at least another year.
RENTS
The rental market has slowed and rents have declined. This is a key metric the FED uses when measuring inflation – a slow down in rents should help produce a 2% inflation rate by September, clearing the way for a rate cut in 2024
INFLATION
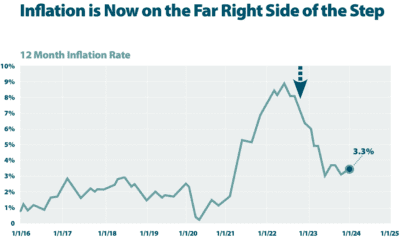
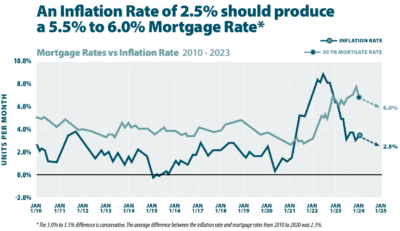
Inflation is still the watchword for the FED; once the economy shows a sustained, lower path toward 2%, they will be more confident to lower the FED funds rate. That should lead to 5.5% – 6% mortgage rates.
SALES AND LISTINGS
Sales in 2023 were 30% below normal, but sales in the entire country are down 25%. Valley Listings are 25% below normal.
As Mortgage Rates come down, both sales and listings should return to more normal levels toward the end of 2024. While unit sales are down 30%, dollar sales are 20% higher – a reflection of the increase in prices.
YEAR OVER YEAR CHANGES
Comparing the average size detached home in each of the Valley cities, Indian Wells had the largest 12 month price gain at +9%. At the other end of the spectrum, Bermuda Dunes had the largest decline over the same 12 month period, at -11%. the same was true for Attached Homes, Indian Wells had a 12 month gain of +16.6%, while Bermuda Dunes had a -7.3% decline.
COUNTRY CLUBS
Detached homes in Country Clubs were down 2.6% in 2023 and Attached Homes in Country Clubs were down 1.7%. Both categories maintained their large prior price gains.
TOP TIER COUNTRY CLUBS $2M+
The average home price in the Top Tier Country Clubs had an overall increase of +3.9%. Thunderbird Heights had the largest price gain at +33.8%, BIGHORN GC had a +8.8% gain. El Dorado CC was about in the middle of the pack with a +4.1% price gain. While Tamarisk CC had the largest decline at -33.3%, followed by The Hideaway at -9.1%. Toscana CC was more moderate with a -2.4% decline.
ACTIVE ADULT COMMUNTIES 55+
Overall the Active Adult Communities had a -2.8% decline in prices. One positive standout is Heritage Palms CC with a 2.8% price gain, while all others show a decline in pricing. Trilogy Polo Club had the largest decline at -7.%. Sun City Shadow Hills held pretty steady with just a -.4% decline. Sun City came in with a -3.8% decline.
INVENTORY
While inventory is recovering, the valley inventory is still 1,000 units below normal
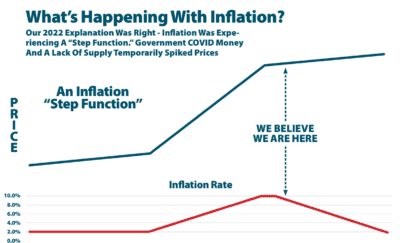
REVIEW OF WHAT OUR MARKET HAVE BEEN THROUGH WITH INFLATION AND INTEREST RATES
1) Government COVID checks, combined with homeowner isolation led to an increase in demand
2) Supply chain interruption, lack of foreign goods and container ships issues, decreased the supply
3) The result, prices surged, creating inflation.
4) The FED responds to the inflation #’s by raising interest rates
5) The combination created an Inflation Step Function


INFLATION MINUS SHELTER
When we take shelter out of the Consumer Price Index (CPI) number, inflation has been less than 2%, (1.9%) since May of 2023. Based on historical numbers, an inflation rate of 2.5% should produce a 5.5% – 6% mortgage rate. We’re on the right path, and expect the FED to lower the FED Funds rate 2, maybe 3 times this year leading to lower mortgage rates by the end of 2024.

AVERAGE LOAN TO VALUE OF HOMES

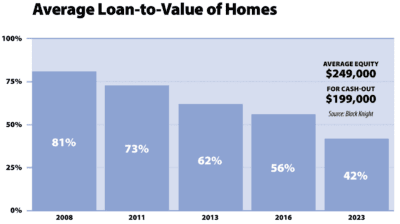
During the financial crisis of 2008, the average homeowner equity was 19%. Today, homeowners on average have 58% equity in their homes, a striking difference from the economic melt-down of 2008. Everyone focuses on 2007 – 2011, which looking at history, was an anomaly in the markets. If you’ve been sitting back waiting for another 2008 style melt-down you’ve been betting against the champ. Since 1947, home prices have increased every year, with two exceptions in 1955 at 0% and 1990 at -1%. Yet everyone focuses on the 2007-20011 timeframe.
CHARTING THE COURSE AHEAD
Baby Boomers make up over 20% of the US population, and 38% of homeowners nationwide. Those who are 55 or older make up 55% of homeownership. 11,200 American turn 65 every day, that’s 4.1 M every year from 2024 – 2027. As this large segment of the population ages, the next natural step in homeownership is to downsize. Based on this demographic, we may start to see more inventory in the markets.
2024 FORECAST
Nationwide real estate appreciation between 4%-5%. Inventory will increase from 2023, but remain historically low.
Sales up 15%-20%
30 year fixed mortgages – high 6%. Mid-low 5% by end of year. A mortgage interest rate at 6% will start to unlock move up buyers.
Treasury / Market spreads will return to normal
Expect unemployment to rise to 4.5%
If you’ve been thinking about selling your home and not sure if now is the right time, we want to arm you with the information you need to make a smart informed decision. We work hard to be one of the leading teams in the Desert Real Estate Market and the information contained in this article is just a small part of how we we work to support you through your home selling journey. Let’s chat about your real estate goals and how they fit in this market.
Thank you, I look forward to speaking with you,

Broker Associate | LUXE Director
Bennion Deville Homes
![]()
